8 Jul 2026
Seasonal Performance Mapping Shapes International Athletic Strategies
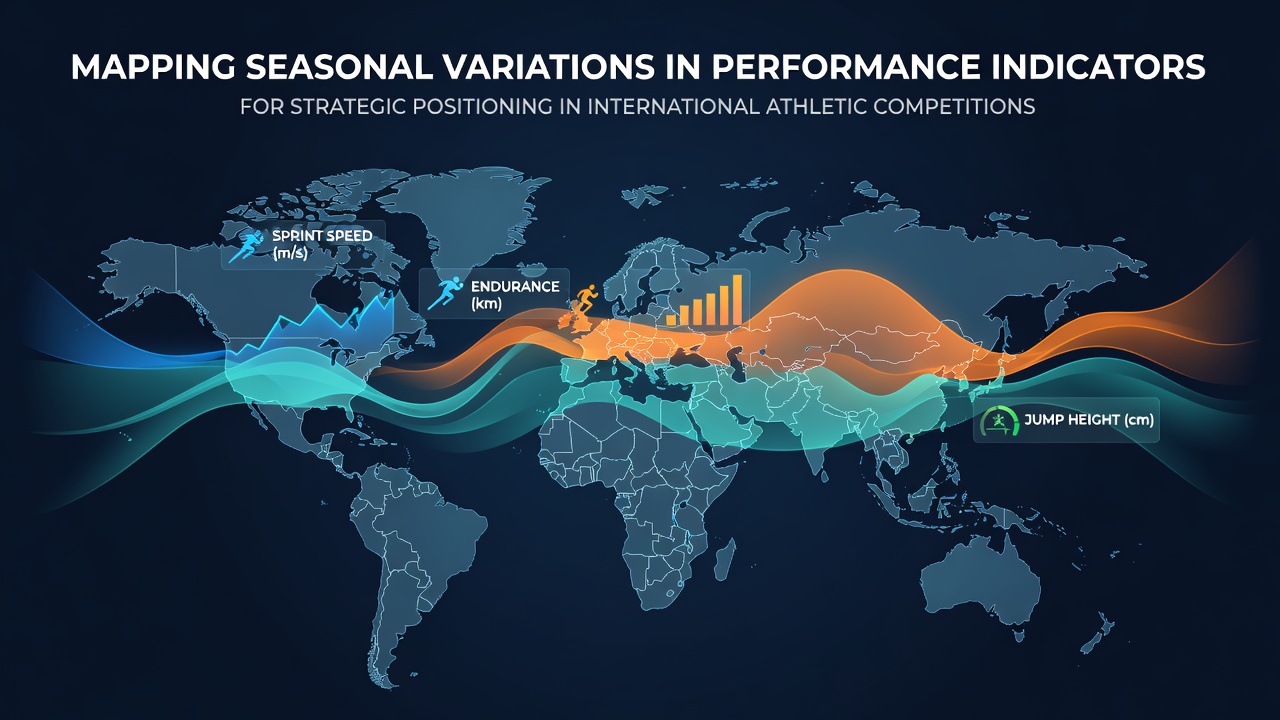 Performance data from international competitions reveals clear patterns when researchers break down metrics by time of year, and those patterns help coaches adjust training loads, recovery protocols, and competition schedules. Studies tracking elite track athletes show that 400-meter times improve by an average of 1.8 percent during late spring compared with mid-winter sessions, while endurance runners post higher VO2-max values in cooler autumn months. These shifts arise because ambient temperature, daylight duration, and training facility access all change across the calendar, and governing bodies now compile multi-year datasets to quantify the effects. National Olympic committees in Europe and North America maintain centralized databases that log heart-rate variability, blood lactate thresholds, and neuromuscular power output every quarter. When analysts compare summer versus winter blocks they find that explosive strength indicators drop 4–7 percent during periods of reduced daylight, yet aerobic capacity markers rise when athletes train at moderate altitudes in the fall. Such granular records allow teams to forecast when an athlete is statistically likely to reach peak form for a specific championship window.
Data Collection Methods Used by Sports Scientists
Modern monitoring relies on wearable sensors that record dozens of variables during every session, and laboratories then cross-reference those numbers with environmental logs from competition venues. Researchers at the Australian Institute of Sport, for example, have published longitudinal reports showing that swimmers achieve personal-best times 2.3 percent more often in meets held between March and May than in November–January events. The difference correlates strongly with water temperature ranges and tapering schedules rather than any single training variable.
Similar work conducted across NCAA Division I programs demonstrates that female soccer players cover 12 percent greater high-speed distance in the first half of the spring season than in late fall, even when total training volume stays constant. Observers attribute part of the gap to pitch conditions and part to hormonal and circadian factors that vary with the solar year. Because these patterns repeat across multiple cohorts, performance analysts treat seasonal adjustment as a standard variable in planning models.
Strategic Positioning for Major Events in 2026
July 2026 features several key selection trials for the 2027 World Athletics Championships and the 2028 Olympic cycle, and federations are already mapping expected performance windows. Data from previous championship cycles indicate that athletes who deliberately peak their speed-strength metrics in late May through early June hold a measurable edge when trials fall in July. Consequently, many national programs shift heavy loading phases to March and April, then insert deliberate recovery micro-cycles in May so that neuromuscular freshness aligns with the target dates.
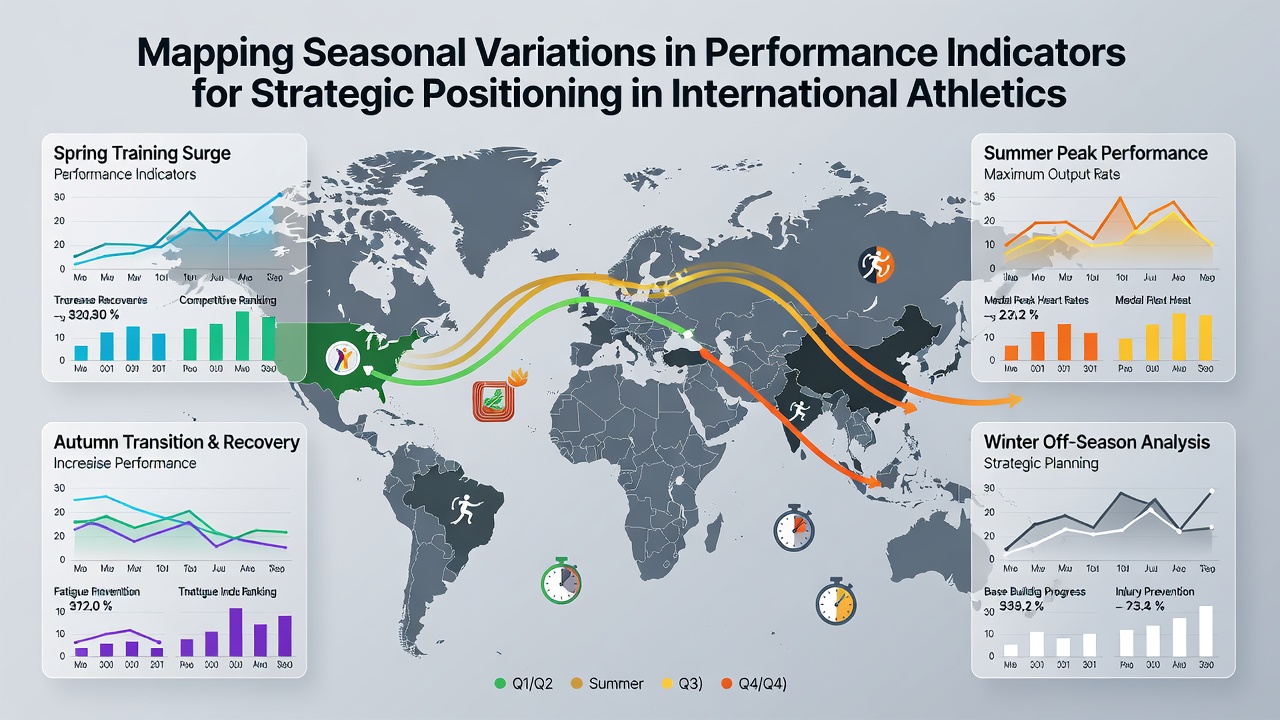
European federations apply comparable logic to rowing and canoeing squads. Historical split-time records collected by World Rowing show that 2000-meter ergometer scores climb steadily from January through May before plateauing, after which small decrements appear if heat and humidity rise sharply. Teams therefore schedule altitude camps in April and May to capitalize on the ascending curve, then move to lower, warmer venues only after the physiological peak has been secured.
Regional Differences and Environmental Factors
Latitude and climate create additional layers of variation. Athletes based in Nordic countries experience compressed outdoor seasons, so indoor facilities and artificial lighting become critical variables. Data shared by the Finnish Olympic Committee indicate that strength-to-weight ratios among ski jumpers improve 5–8 percent when training blocks include controlled UV exposure during December–February. In contrast, programs in equatorial regions must manage consistent heat load year-round and therefore emphasize hydration and cooling protocols more than seasonal periodization.
North American basketball and volleyball squads that compete in both indoor and beach formats also track court-surface temperature effects. Studies from the University of British Columbia report that vertical jump height decreases 3.1 centimeters on average when ambient temperature exceeds 28 °C, prompting coaches to move explosive sessions to early morning or climate-controlled halls during summer months.
Integration With Competition Calendars
International federations publish annual calendars years in advance, and performance-mapping software now ingests those dates alongside historical weather archives. The result is a set of probability curves that forecast an athlete’s expected placement range for any given event. One study released by the International Olympic Committee’s medical commission examined 12,000 competition results across eight sports and found that accounting for seasonal performance drift improved placement prediction accuracy by 11 percent compared with models that ignored calendar effects.
Teams feed these curves into selection decisions. An athlete whose personal-best window falls in September may receive priority for autumn championships, whereas a sprinter whose metrics crest in June is steered toward earlier selection trials. The approach reduces the number of athletes forced to compete outside their statistically optimal periods and lowers injury incidence linked to mistimed peaking attempts.
Conclusion
Mapping seasonal variations supplies federations and athletes with an evidence-based framework for scheduling training stress, recovery, and competition exposure. As datasets grow longer and sensor technology captures finer physiological signals, the precision of these forecasts continues to increase. Programs that systematically incorporate seasonal performance indicators position their athletes more effectively within crowded international calendars, and the same datasets help medical staff anticipate when workload adjustments will yield the greatest protective benefit.