5 Jun 2026
Atmospheric Influences on Outdoor Sports Performance: Insights for Strategic Betting
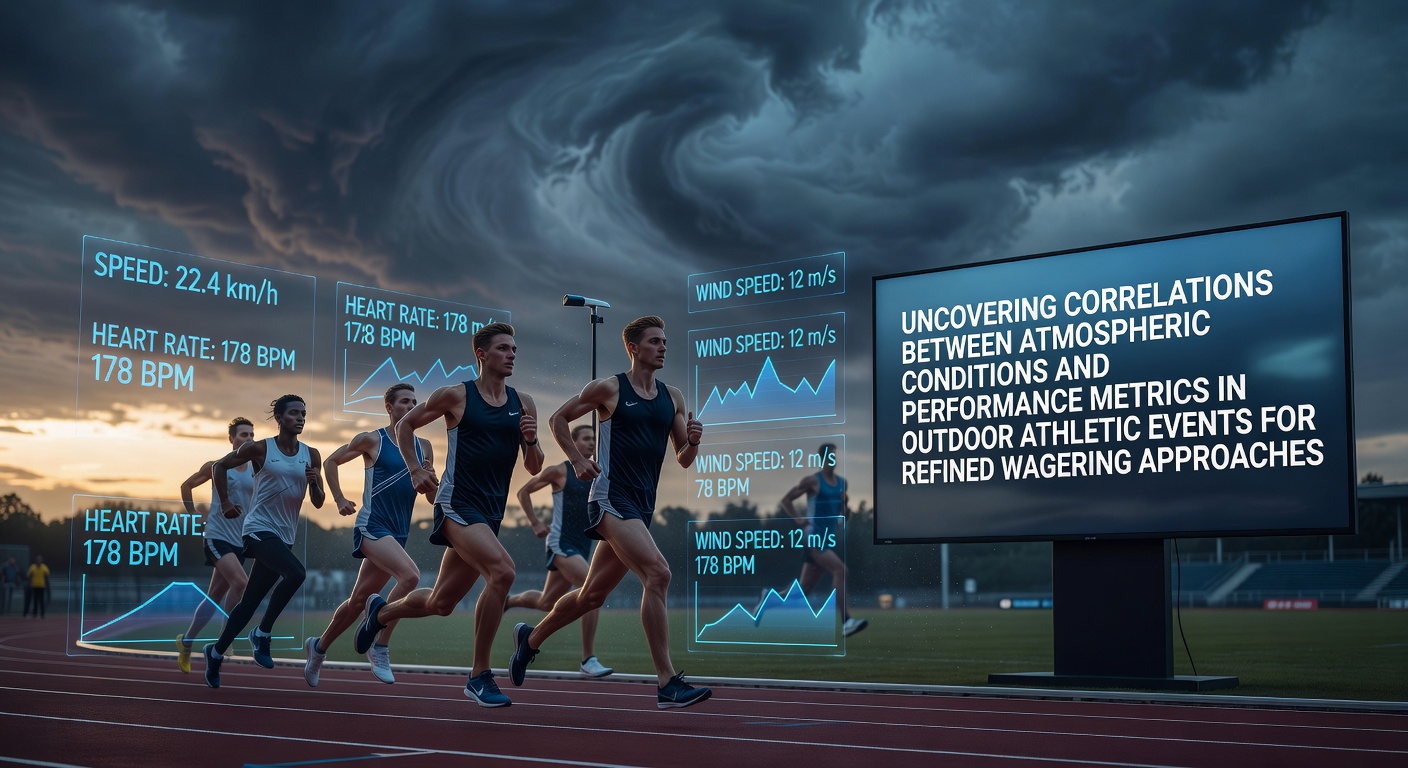
Outdoor athletic events expose competitors to shifting atmospheric variables that directly shape measurable performance outcomes, and analysts track these patterns to refine predictive models used in wagering markets. Temperature swings, humidity levels, wind speeds, and barometric pressure changes alter everything from endurance capacity to reaction times, creating measurable edges when historical datasets align with upcoming event forecasts. Research from institutions across multiple continents demonstrates consistent correlations between these factors and results in sports like marathon running, tennis, and open-air cycling.
Temperature Thresholds and Endurance Metrics
Studies conducted by the University of Sydney's thermal physiology unit show that core body temperatures rising above 38.5 degrees Celsius reduce sustained power output by 6 to 12 percent in endurance events lasting longer than 90 minutes, with elite marathon runners exhibiting the sharpest declines once ambient air exceeds 28 degrees. Data collected during the 2024 Paris Olympics and subsequent international meets confirm that athletes starting in cooler morning conditions post faster split times in the final 10 kilometers compared with those racing under midday heat loads. Wagering platforms that incorporate real-time temperature forecasts alongside athlete heat-acclimatization histories gain statistical advantages when setting lines for distance events scheduled in June 2026 across European circuits.
Humidity, Wind, and Precision Sports
High relative humidity impairs evaporative cooling and elevates perceived exertion rates, yet its impact varies sharply by sport. Tennis performance data aggregated by the International Tennis Federation reveals that first-serve accuracy drops 4 to 7 percent when humidity climbs above 75 percent during matches exceeding two hours, while baseline rally lengths shorten as players conserve energy. Wind patterns introduce additional variance: crosswinds above 15 kilometers per hour increase error rates on down-the-line shots by measurable margins according to match-tracking systems deployed at major tournaments. Observers note these shifts become especially pronounced during grass-court seasons when surface speeds already interact with atmospheric resistance.
Barometric Pressure and Aerodynamic Events
Lower air density at higher altitudes or during low-pressure weather systems reduces aerodynamic drag, benefiting sprinters and throwers while sometimes disadvantaging endurance cyclists who lose drafting efficiency. Canadian Sport Institute researchers documented a 0.8 to 1.3 percent improvement in 100-meter times at venues situated above 1,500 meters when barometric readings fell below 850 hectopascals, a finding corroborated by timing data from multiple Diamond League meets. Bettors monitoring pressure gradients 48 hours before competition can adjust expected margins in field events where small percentage gains translate into outright market movements.
Integrating Forecasts into Wagering Models
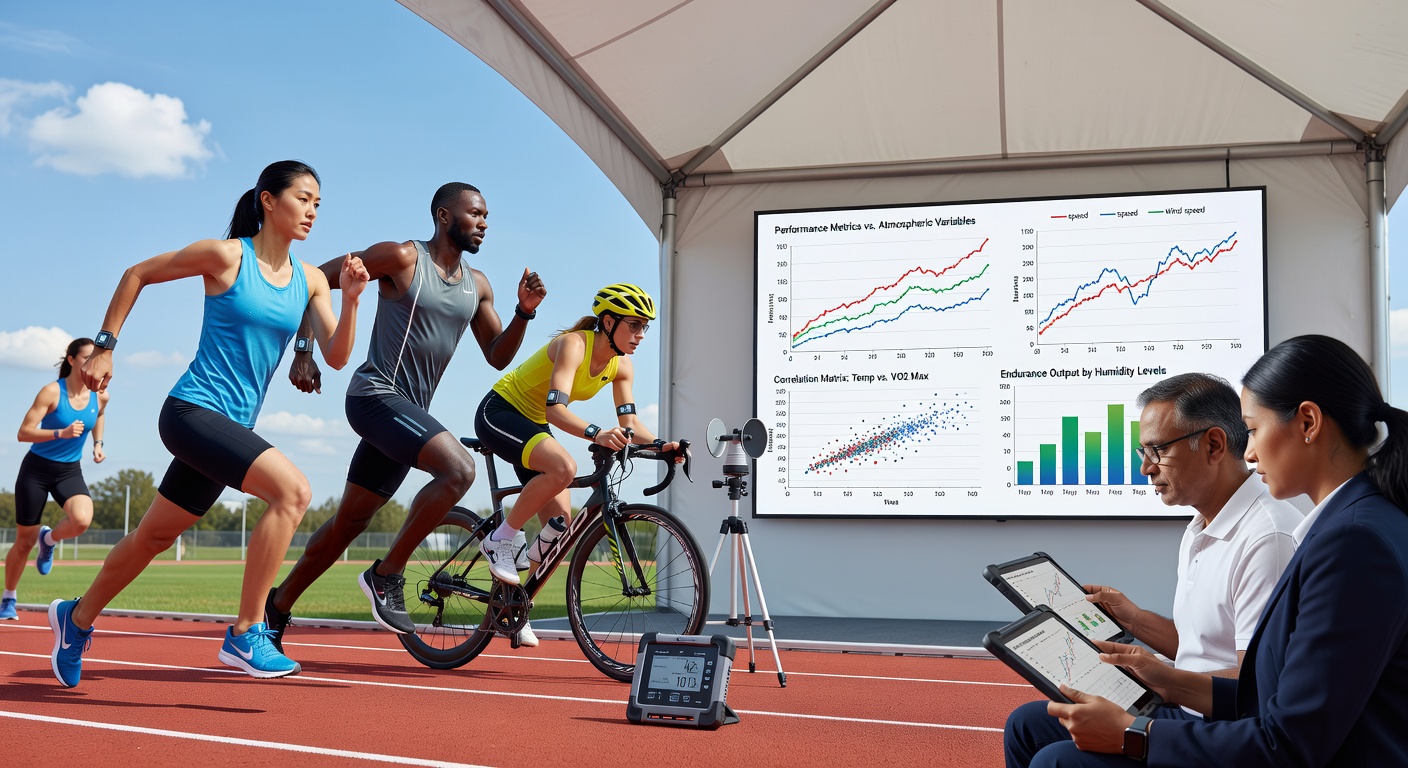
Professional syndicates now combine meteorological APIs with granular performance databases to generate probability adjustments before odds compilation. A 2025 report issued by the Australian Institute of Sport quantified that incorporating dew-point and wind-vector projections improved model accuracy by 11 percent across a season of outdoor track and road events. Those who have studied these integrations observe that value emerges most reliably in under-the-radar competitions where public bettors overlook environmental variables. European racing federations publish post-event weather logs that allow retrospective calibration of algorithms, tightening projections for subsequent fixtures.
Regional Variations and Seasonal Patterns
Coastal venues experience different humidity-wind interactions than inland circuits, and datasets from the Japan Meteorological Agency highlight how Pacific typhoon season alters scheduling and performance baselines in regional marathons. In contrast, North American summer circuits contend with rapid afternoon thunderstorm development that shortens warm-ups and changes muscle readiness. Analysts cross-reference these regional signatures with athlete travel histories to isolate fatigue multipliers that standard form guides miss. June 2026 schedules already list several high-altitude European stages where pressure-related aerodynamic gains are expected to favor certain sprinters over pure endurance specialists.
Conclusion
Atmospheric data continues to refine the quantitative framework supporting outdoor event wagering, with temperature, humidity, wind, and pressure each contributing distinct statistical signatures across athletic disciplines. Organizations maintaining comprehensive environmental logs alongside performance metrics enable more precise probability estimates that account for conditions prevailing on competition day. As forecasting resolution improves and historical datasets expand, the alignment between meteorological variables and athletic outcomes offers structured inputs for market participants seeking measurable edges.